

Your platform just closed its biggest month. Trade count is up, registered accounts are up, and the board deck looks healthy. Then the CFO asks one plain question: “What do we keep from the average trade after everything it costs us to complete it?” Nobody in the room has a number.
That silence is the problem. Carbon platform unit economics is the profit or loss on one unit of activity: one trade, one account, one tonne of CO₂e moved. Most carbon platforms are priced and built without it. Revenue climbs because volume climbs. Margin shrinks because cost per trade climbs faster than anyone measured.
Read this if: you are a founder, CEO, or CFO planning or running a carbon exchange, marketplace or brokerage, you earn a take rate or a subscription, and you cannot yet state your contribution margin per trade in one number.
Generic marketplace advice tells you to track take rate, acquisition cost, lifetime value, and contribution margin. That advice is right and incomplete. A carbon platform carries cost lines a normal marketplace never meets.
A product marketplace ships a parcel. A carbon platform must prove that one serial-numbered credit was genuine, unretired, eligible for the buyer’s use, and correctly transferred. That proof costs money on every trade.
The cost drivers that surprise teams most:
None of these appear as a line in the first financial model. All of them appear in month eight.
“Unit” is not one thing on a carbon platform. Pick the wrong one and the model lies to you.
| Unit | What it measures | Best question it answers | Common mistake |
|---|---|---|---|
| Trade | Revenue and cost of one completed transaction | Do we make money when someone trades? | Using average ticket size and ignoring the spread between small and large trades |
| Account | Lifetime contribution of one onboarded buyer, seller or broker | Is acquiring and keeping this customer worth it? | Counting signups instead of accounts that actually trade |
| Credit (tCO₂e) | Cost to issue, hold, move and retire one tonne | Where does cost scale with volume of carbon, not trades? | Ignoring that cost per tonne falls with big tickets but rises with fragmented ones |
Start your carbon platform unit economics model with the trade. It is the unit closest to cash, and it exposes most of the leaks.
This stack is the working core of carbon platform unit economics. Think of a trade as a stack. Revenue sits on top. Each variable cost takes a slice. What remains is contribution, the money that pays for your fixed team, office, and roadmap.
| Layer | Line | Who usually owns it |
|---|---|---|
| Revenue | Take rate, listing fee, retirement fee, data fee | Founder / CFO |
| Variable cost 1 | Payment and settlement rails, FX | CFO |
| Variable cost 2 | Registry API calls and status sync | CTO |
| Variable cost 3 | KYC/KYB checks, amortised per account | Compliance / CFO |
| Variable cost 4 | Compute, storage, audit-log retention | CTO |
| Variable cost 5 | Reconciliation exception handling | Operations / CTO |
| Variable cost 6 | Customer support per trade | Operations |
| Contribution | What is left per trade | Everyone |
Two things stand out. First, no single person owns the whole stack, which is why it goes unmeasured. Second, the CTO controls more of it than the P&L suggests. Architecture decisions made in month one decide the size of those slices in year two.
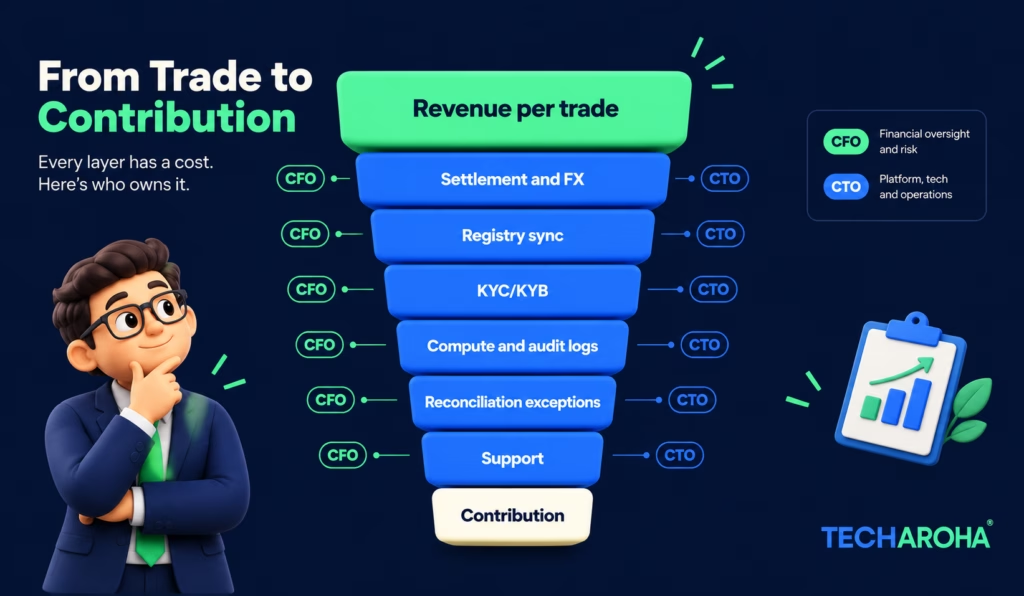
Alt text: Stacked diagram showing carbon platform unit economics, with revenue per trade reduced by six variable costs down to contribution.
The numbers below are illustrative. They show the method, not your results. Assume an average ticket of $15,000 and three customer segments with different negotiated take rates.
| Segment | Take rate | Revenue per trade | Variable cost per trade | Contribution | Margin |
|---|---|---|---|---|---|
| Aggregators and project developers | 1.5% | $225.00 | $95.00 | $130.00 | 58% |
| Institutional buyers | 0.5% | $75.00 | $62.00 | $13.00 | 17% |
| Anchor strategic buyer | 0.25% | $37.50 | $50.00 | -$12.50 | -33% |
Now mix them: 30% of trades from aggregators, 50% institutional, 20% from the anchor buyer.
Assume fixed monthly costs of $60,000. Break-even is about 1,400 trades a month.
Here is the trap in these carbon platform unit economics. The anchor buyer is the one your sales team celebrates, because they bring volume and a logo. Every trade they add loses money. If that segment grows from 20% to 40% of trades while the others shrink proportionally, revenue per trade falls and break-even moves further away, even as your headline volume hits a record.
That is the pattern behind “we are growing but not getting richer.” Carbon platform unit economics would have flagged it before the contract was signed.

Most founders get stuck because finance and engineering use different vocabularies. Translate them.
| Decision | The CFO needs | The CTO must deliver |
|---|---|---|
| Pricing | Margin per trade by customer segment | A fee engine that supports tiered, per-segment and per-registry rates without code changes |
| Forecasting | Cost per trade at 10x volume | Cost tagging on every event, so cost can be traced to the trade that caused it |
| Cash control | Net settlement amounts, not gross | Settlement logic that records FX, bank and rail fees against each trade |
| Risk | Exception cost and error exposure | Automated reconciliation against registries, with exceptions queued and measured |
| Roadmap | Which feature protects margin | A cost-per-trade dashboard that ranks engineering work by money saved |
Strong carbon platform unit economics need both columns filled in. If your CFO cannot get the left column, the CTO cannot prioritise the right column. They are one problem described twice.
Cost per trade is partly a market outcome and partly a design choice, so your carbon platform unit economics are partly in your engineers’ hands. These five choices move it most.
None of this needs a bigger budget. It needs to be decided before the first line of settlement code is written, because retrofitting cost tagging into a live ledger is where many platform owners discover the real price of skipping this step.
Founders often pick a revenue model from competitor pricing pages. Pick it from your cost stack instead, because the cost stack is what your carbon platform unit economics must cover.
| Revenue model | Margin behaviour as volume grows | Watch out for |
|---|---|---|
| Take rate on each trade | Scales with ticket size, but negotiated discounts erode it fast | Anchor buyers who push the rate below your cost per trade |
| Flat fee per trade | Protects small trades, caps upside on large ones | Underpricing large tickets |
| Subscription or licence | Predictable, but heavy users cost you more | Fixed price with uncapped usage |
| Listing and issuance fees | High margin, low volume | Revenue depends on project pipeline, not trading |
| Retirement and certificate fees | Tied to end-use demand, steady | Small per-unit value |
| Data and analytics access | Near-zero marginal cost once built | Needs a real audience first |
| White-label licensing | Shifts infrastructure cost to the tenant | Support load can erase the gain |
Most healthy platforms blend three of these. A take rate alone leaves you exposed to price pressure. A subscription alone leaves you exposed to heavy users. The right blend depends on your trade-size distribution, which is why you need the stack above before you choose.
Run through this in your next leadership meeting.
If you cannot complete four of these seven, your carbon platform unit economics are guesses and your platform is growing on assumptions.
An off-the-shelf platform gives you someone else’s cost structure and someone else’s fee logic. You inherit their margin ceiling. A custom platform lets you design fee rules, reconciliation and settlement around your own revenue model, so carbon platform unit economics become something you control rather than something you discover.
Techaroha builds carbon infrastructure with that commercial view from the start. We built Carbon Plant, an FSA-registered NFT-based carbon credit exchange, and Planet First Registry, the registry infrastructure behind it. Both taught us where cost hides: in registry sync, reconciliation, and compliance, not in the matching engine most owners fixate on. When we scope a custom platform, we map revenue lines to cost lines before we write a specification. If you are still deciding between building and buying, our carbon credit exchange platform page explains what a custom build covers.
Bring your pricing, your customer mix and your current or planned platform. In a Revenue Architecture Consultation, we will pressure-test your carbon platform unit economics and:
Sometimes the honest answer is that your current setup is fine. You will leave with numbers either way. Book your Revenue Architecture Consultation with Techaroha today.
Volume is easy to celebrate and easy to buy. Margin is harder to see. Carbon platform unit economics gives your CFO a number to forecast and your CTO a target to build toward. Map the stack before launch, price each segment against it, and design the architecture to protect it. Growth then adds profit instead of hiding losses.