
A mid-size manufacturing company’s ESG director logs into a carbon exchange. She selects 5,000 tonnes of nature-based removal credits, clicks purchase, and receives a settlement certificate. The transaction took four minutes. The audit fails six weeks later. Not because the credits were fraudulent. Not because the registry was wrong. Because her company – a Category A firm under the newly enacted SBTi Corporate Net-Zero Standard V2.0 – purchased credits that weren’t routed to the correct Ongoing Emissions Responsibility tier, weren’t mapped to any internal carbon price floor, and can’t be traced back to her Scope 3 accounting data. The platform she used treated a compliance-critical procurement event the same way Amazon treats a household purchase. This is the failure mode that makes carbon procurement portal development the most consequential engineering conversation in climate finance right now. The Compliance Landscape Has Just Fundamentally Shifted On June 11, 2026, the Science Based Targets initiative released Corporate Net-Zero Standard V2.0 — the most significant overhaul of corporate climate target-setting since the original standard launched in 2021. For carbon market platform operators, the headline isn’t the emissions reduction trajectories or the scope target changes. It’s the Ongoing Emissions Responsibility (OER) framework. OER formalizes, for the first time, a structured route for carbon credits within a corporate net-zero strategy. It replaces the vague “Beyond Value Chain Mitigation” label with a tiered recognition programme that has hard price-floor requirements: What this means operationally: a corporate buyer making a voluntary carbon credit purchase under V2.0 cannot simply buy credits at market rate and retire them. They must know at the moment of purchase which OER pathway they’re qualifying for, whether the credits meet Core Carbon Principle (CCP) eligibility for that pathway, what internal price floor that transaction is being booked against, and how the purchase maps to their Scope 1, 2, and 3 accounting data. A standard B2B carbon marketplace cannot perform any of these functions. This is what makes purpose-built carbon procurement portal development a non-negotiable infrastructure priority for any operator serving institutional buyers. Why Your Current Platform Architecture Fails This Test Most carbon exchanges and marketplace platforms were architected for one purpose: match willing buyers with willing sellers at a price both parties accept. The order management system (OMS) records the trade, triggers a registry retirement call, and issues a settlement certificate. Full stop. Under SBTi V2.0’s OER framework, that architecture has exactly three critical gaps. Gap 1: No Scope-Aware Order Context A carbon credit purchase by a Category A corporate buyer is not an isolated transaction. It’s a claim against their existing Scope 1, 2, and 3 emissions inventory. The platform has no way of knowing whether the buyer is purchasing credits to address Scope 1 direct emissions (hard-to-abate industrial processes), Scope 2 purchased electricity residuals, or Scope 3 supply chain emissions — and these distinctions matter for audit defensibility. Any serious carbon procurement portal development program must solve for Scope-linked order context before writing a single OMS line. Gap 2: No OER Tier-Matching Engine When a buyer places an order, the platform needs to programmatically determine: Is this buyer pursuing the $20/tCO₂e pathway (Recognised) or the $80/tCO₂e pathway (Leadership)? Are the credits in the requested lot CCP-eligible for that specific pathway? Does the order value, applied against the buyer’s total ongoing emissions footprint, satisfy the percentage threshold for their target recognition tier? Standard exchange matching engines are built for price-time priority, not parameter-based compliance routing. They cannot answer any of these questions. Gap 3: No Internal Price Floor Enforcement V2.0’s OER framework requires that the internal carbon price applied to a purchase be defensible in a third-party audit. If a corporate buyer’s finance team books a credit purchase at a market clearing price of $14/tonne while claiming Recognised pathway status (minimum $20/tCO₂e threshold), the claim is invalid — even if the credits themselves are CCP-eligible. The platform’s OMS must either enforce a minimum transaction price floor dynamically or surface an explicit attestation workflow that allows the buyer to document supplementary internal carbon pricing above the market price. Carbon procurement portal development that skips this layer will produce audit failures for every corporate buyer on the Recognised or Leadership pathway. The Architecture That Actually Works Building a carbon procurement portal development infrastructure that handles SBTi V2.0’s OER requirements is not a configuration problem. It’s a data model and routing engine problem. Here’s what the correct architecture looks like. Layer 1: The Carbon Accounting API Integration Layer Before a buyer can place a compliant OER order, the platform needs to know their emissions baseline. That data doesn’t live in your carbon exchange — it lives in the buyer’s GHG accounting system (Normative, Greenly, Watershed, or a custom internal system). The portal’s integration layer must expose a structured API that pulls: This data populates a buyer-specific compliance dashboard. Every order a corporate buyer places is evaluated against this live context, not processed in isolation. This is the foundational capability that separates enterprise-grade carbon procurement portal development from a retail marketplace with a compliance-sounding landing page. Layer 2: The OER Tier-Matching Engine Once the buyer’s emissions context is loaded, every incoming order request passes through a tier-matching engine that operates as a pre-routing validation layer before the order ever reaches the matching engine. The tier-matching engine performs three checks: Pathway eligibility check: Does the buyer’s declared internal carbon price meet the floor for their target OER tier? ($20/t for Recognised, $80/t for Leadership.) If the market-clearing price for the requested credit lot falls below the floor, the engine either triggers a price attestation workflow or routes the order to a supplementary carbon pricing ledger entry. CCP pool routing: Under V2.0, not all voluntary carbon credits qualify equally. Credits must meet Core Carbon Principle standards for OER use. The tier-matching engine queries the credit’s CCP eligibility flag – a structured attribute set during credit ingestion from the registry and routes the order to the appropriate CCP-eligible sub-ledger. Engaged pathway orders route to a broader set of eligible
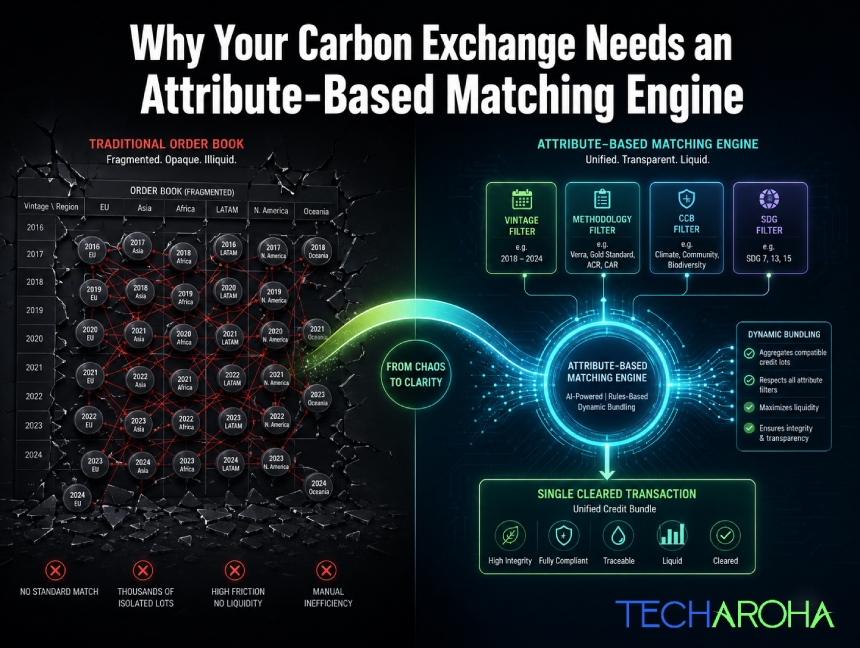
The trading infrastructure built for stocks and Bitcoin will systematically destroy liquidity in any carbon exchange. Here is the architectural fix and the exact engineering logic behind it. Carbon markets are at an inflection point. Voluntary carbon credit issuances have grown into a multi-hundred-billion-dollar projected market, institutional buyers are entering at scale, and Article 6.4 is formalizing cross-border credit flows in ways that would have seemed theoretical five years ago. Exchange founders are raising capital. Trading desks are staffing up. And almost every single one of them is about to make the same catastrophic infrastructure mistake. They are going to build a Central Limit Order Book (CLOB). The CLOB is the gold standard of financial exchange architecture. It powers the NYSE. It underpins every top-tier crypto exchange. It is fast, transparent, price-time priority-driven, and battle-tested. For carbon credits, it is the wrong tool in precisely the way that a pneumatic drill is the wrong tool for a surgical procedure. Not ineffective in general. Lethally ineffective here. This article is a precise technical and economic explanation of why, and a blueprint for the architecture that actually works: the carbon credit trading platform matching engine built on attribute-indexed, parameter-based order resolution. If you are building or operating a carbon exchange, a carbon trading desk, or evaluating infrastructure for a voluntary carbon market platform, this is the engineering decision that will determine whether your liquidity pool deepens or evaporates. Part 1: Why the CLOB Destroys Carbon Liquidity – The Structural Problem A Central Limit Order Book works on one foundational assumption: The asset is fungible. One share of AAPL is identical to every other share of AAPL. One Bitcoin is identical to every other Bitcoin. The order book can aggregate all bids and all asks into a single depth ladder because every unit on both sides of the book represents the same underlying thing. Carbon credits are not the same underlying thing. A 2021 cookstove credit from a Gold Standard-certified project in rural Kenya and a 2025 direct-air-capture credit from a Climeworks facility in Iceland are both “one tonne of CO₂ equivalent.” That is where the similarity ends.They have different: And, critically, they clear at prices that can differ by a factor of 10 or more. Institutional buyers do not treat them as interchangeable. Compliance frameworks do not treat them as interchangeable. Even voluntary corporate buyers with qualitative net-zero targets frequently cannot treat them as interchangeable without triggering greenwashing liability. What Happens When You Force Carbon Credits Into a CLOB? The matching engine identifies the asset by symbol. To maintain the fiction of fungibility across radically different credits, you have only two options: In a mature carbon market with: …you end up with thousands of discrete order books. Each one is individually empty. A liquidity pool that should be $50 million deep becomes: The consequences are predictable: The platform appears broken because, functionally, it is. This is not hypothetical. It is exactly why the voluntary carbon market spent years operating primarily as an OTC market conducted through brokers and phone calls. The asset’s heterogeneity made exchange-style infrastructure practically non-functional for real trading.A carbon credit trading platform matching engine that copies traditional financial exchange architecture without accounting for this reality will simply recreate that illiquidity problem at scale. Part 2: The Right Architecture – Attribute-Based Matching Over an Indexed Credit Graph The correct mental model for a carbon exchange is not a stock exchange. It is closer to a parametric procurement engine. The kind of system that allows a large corporate buyer to issue a single tender specification (“supply 10,000 units of this type of component, meeting these tolerances, at under this price”) and have the system dynamically identify, aggregate, and clear supply from multiple disparate sources to fulfill the single order. Applied to carbon, the architecture has three layers. Layer 1: The Credit Attribute Graph (Transactional Database) Every credit lot is stored as a structured object with a rich attribute schema not merely a quantity and price.A credit record contains: This is a normalized relational schema in your primary transactional database. PostgreSQL is an appropriate choice for ACID compliance on settlements. But the transactional database alone cannot power real-time matching at query complexity levels that carbon requires. Write about our blog that explains- The Ghost Credit Trap: What No One Tells You About Carbon Registry API Integration Layer 2: The Attribute Index (Elasticsearch or Redis Search) This is the layer many platforms either skip or implement incorrectly. The carbon credit trading platform matching engine requires a secondary search index optimized for: Elasticsearch Advantages Redis Search Advantages For institutional-scale exchanges, a hybrid architecture makes sense: Example Redis Search Schema With this index in place, the matching engine can execute parametric queries in real time. A buyer placing an order like “Buy 10,000 tonnes of any Nature-Based Removal, vintage 2023 or later, CCB certified, under $18 per tonne” translates directly to an indexed query: Example Buyer Query Buyer requests: Buy 10,000 tonnes of any Nature-Based Removal, vintage 2023+, CCB certified, under $18/tonne. This query executes against the in-memory index in under 5 milliseconds and returns every matching available lot ranked by price, regardless of which project, geography, or vintage within the buyer’s specification each lot originates from. Layer 3: The Dynamic Bundling and Clearing Algorithm The search query returns a ranked list of available lots. The matching engine’s clearing algorithm then executes a greedy fulfillment sweep: The buyer receives a single trade confirmation -10,000 tonnes cleared at a volume-weighted average price of $16.43/tonne across 7 credit lots, not 7 individual trade notifications across 7 empty order books. The seller-side experience is equally clean: individual lot holders have their available inventory consumed by the engine, with settlement proceeds routed per standard clearing logic. This is the structural breakthrough. The carbon credit trading platform matching engine does not require both sides to agree on a specific lot. It requires only that a buyer’s parameter specification encompasses the seller’s lot attributes. The parameter space is the order

Imagine this scenario. A Singapore-based airline’s treasury desk logs into your carbon exchange and purchases 50,000 tonnes of what they believe are Article 6-authorized ITMOs – credits they’ll use to meet CORSIA compliance obligations. Simultaneously, a European manufacturing company’s ESG team purchases 50,000 tonnes of standard Verra VCS voluntary credits from the same liquidity pool. Both transactions clear in the same matching engine. Both draw from the same inventory bucket. Both produce settlement certificates from the same registry integration. Here is the problem: only one of those trades required the host country to apply a corresponding adjustment in its national emissions accounting. Only one generates an ITMO that counts toward the buyer’s Nationally Determined Contribution compliance. And if your exchange’s matching engine cannot tell these two credit types apart at the moment of execution, you have just created legal liability for the airline buyer, accounting exposure for the host country, and reputational risk for your platform in a single transaction. This is the compliance problem that Article 6 carbon exchange compliance was specifically designed to prevent. And it is the problem that virtually no generic carbon trading software is architecturally equipped to solve. Why Article 6 Creates a Two-Asset-Class Problem Before Article 6 was operationalized with the UN Supervisory Body’s Paris Agreement Crediting Mechanism (PACM) issuing its first credits in February 2026, and 106 bilateral Article 6.2 arrangements now in place across 53 host countries, carbon platforms could treat all voluntary credits as functionally equivalent. Price, project type, vintage year, and registry were the sorting dimensions that mattered. Article 6 fundamentally breaks that simplicity. Under the Paris Agreement framework, a carbon credit now carries one of at least three authorization states with materially different legal implications: An Article 6.2 ITMO is a credit that a host country has formally authorized for international transfer. The host country applies a corresponding adjustment to its own national GHG inventory – reducing the claimed emission reduction in its NDC accounting by exactly the quantity being sold. This ensures the reduction is counted only once globally: toward the buyer’s compliance obligation, not the host country’s NDC. An Article 6.4 authorized credit (a PACM-issued unit) operates under centralized UN Supervisory Body oversight, with corresponding adjustments applied when the credit is authorized for NDC use or Other International Mitigation Purposes. A standard VCM credit from Verra, Gold Standard, or the American Carbon Registry may carry no corresponding adjustment at all. The host country may still be claiming those same reductions in its own national reporting. For a corporate making a voluntary ESG contribution, this is currently acceptable. For CORSIA compliance, for government NDC procurement, or for claims subject to the EU Green Claims Directive, it is not. A carbon exchange that allows these three credit types to mix in a single inventory pool that matches buyer orders without filtering for authorization status is not just architecturally careless. It exposes every trader on the platform to liability under international climate accounting rules that are now actively enforced. Article 6 carbon exchange compliance is not a feature to be added after launch. It is a design constraint that must shape the platform’s core data model before the first line of schema is written. For exchange operators, the cost of redesigning authorization logic after launch is significantly higher than implementing it during platform architecture. Once credits have been traded, settled, and reported under an incorrect authorization model, remediation becomes both technically complex and commercially disruptive. What “Corresponding Adjustment” Actually Means at the Database Level Policy documents describe corresponding adjustments in accounting terms: the host country records an upward adjustment to its reported emissions equal to the quantity of ITMOs transferred abroad. This sounds like a government reporting obligation. It is also a live data synchronization problem for your exchange. Your platform needs to know, at the moment a trade is matched, whether a corresponding adjustment has been confirmed, is pending, or does not apply to a specific credit in inventory. That status is not static. A credit originally issued under a VCM standard may subsequently receive Article 6 authorization if the host country issues a Letter of Authorization and notifies the UNFCCC hub. Conversely, a credit that appeared to hold CA status may have that authorization revoked if the host country’s NDC trajectory changes. Article 6 carbon exchange compliance, therefore, requires your platform to treat authorization status as a mutable, continuously refreshed attribute, not a one-time label applied at credit onboarding with the UNFCCC International Registry’s Article 6 hub, national registry APIs, and host country LOA document hashes as the authoritative update sources. This has direct implications for three architectural decisions that define whether your platform can genuinely claim Article 6 carbon exchange compliance. Architecture Decision 1: Dynamic Asset Tagging Every credit entering your exchange must receive an authorization tag at the point of ingestion and that tag must be treated as a live operational attribute rather than a static metadata field. The tag schema for Article 6 carbon exchange compliance needs to carry at a minimum: The tag is initialized from the UNFCCC hub API (for ITMOs and PACM credits) or from the relevant voluntary standard registry (for VCM credits), and updated via webhook whenever the source registry reflects a status change. Credits held in inventory during a CA status transition are automatically quarantined from the live order book until the transition is confirmed or reverted. The critical design principle for Article 6 carbon exchange compliance is that every tag state change must be logged immutably — with a timestamp, source reference, and the triggering event — because corresponding adjustment disputes will be resolved by audit trail, not by conversation between compliance officers. Architecture Decision 2: Permissioned Sub-Ledgers The most operationally dangerous failure mode in Article 6 carbon exchange compliance is inventory commingling — storing ITMO-authorized credits and VCM-standard credits in the same database pool without segregating their transfer rules. The fix is not simply adding an authorization_type column to a unified credits table. A column-based approach allows

Here is a failure scenario no development team writes into their architecture documents, but every serious carbon trading platform eventually confronts. A corporate buyer completes a purchase of 10,000 tonnes of verified emission reductions on your platform. Your system marks the credits as retired, issues a certificate, and closes the transaction. Forty-eight hours later, a second buyer purchases what appears to be the same inventory because the Verra registry, running on a batch synchronization cycle, has not yet confirmed the retirement. It still shows the credits as active on its canonical ledger. You have just had a double-sell event on verified environmental assets. The first buyer’s ESG claim is technically unsupported until the registry catches up. This is the ghost credit problem. It is not a project integrity issue. It is not a regulatory oversight. It is a software architecture failure one that emerges directly from how the carbon registry API integration is designed, or more precisely, how it is not designed. And in 2026, as both voluntary and compliance carbon markets are scaling simultaneously, and institutional buyers are demanding auditable settlement trails, ghost credits are no longer a curiosity. They are a liability. Understanding why this failure mode exists and how to architect your way out of it requires a clear-eyed look at what carbon registry API integration actually involves at the engineering level, not the product level. Why Carbon Registries Are Not Like Other Financial APIs The first mistake most teams make when approaching carbon registry API integration is assuming that registry connectivity is a standard API integration problem, something that can be solved with a generic connector library, some retry logic, and a polling job. It cannot, and the reason comes down to how carbon registries were built and why they differ so dramatically from financial market infrastructure. A securities exchange maintains a single authoritative ledger, operated by a central clearinghouse, with standardized data schemas, defined settlement cycles, and consistent API contracts across all participants. When you integrate trading software with equity market infrastructure, you are solving genuinely hard engineering problems, but you are solving them against a known and consistent counterparty. Carbon registry API integration involves no such consistency. The four primary systems your trading platform must connect to Verra (VCS), Gold Standard, I-REC, and national compliance registries such as India’s Grid Controller registry, the UK ETS registry, or California’s CITSS were each built independently, by different vendors, at different times, for different policy purposes. None were designed with third-party trading platform integration in mind. None exposes a shared data model. None shares an API specification. And critically, none behaves the same way when your integration layer hits operational limits. This is the foundational reality of carbon registry API integration that every serious build must address before any other architectural decision. The Rate Limit Problem: When Your Order Book Becomes a Fiction The most immediately dangerous consequence of naively implemented carbon registry API integration is what happens to your order book when the integration layer hits throughput limits. Verra’s API and most voluntary registry APIs- enforce rate limiting. During peak periods, such as the final hours before a corporate reporting deadline or when a large block purchase is being executed, your carbon registry API integration layer begins queuing retirement requests rather than processing them in real time. At that point, the integration faces a choice that most developers make incorrectly: update your internal platform state optimistically and synchronize with the registry later, or hold the state transition until registry confirmation arrives. If you choose optimistic updates, you get ghost credits. Your platform marks a credit as retired. The registry has not confirmed it. Any system that queries the registry directly – an auditor, a compliance portal, or a second buyer sees an active credit. If you choose to hold, you get stale data. Credits that are committed in in-flight transactions continue to appear available on your order book to other buyers, because your rate-limited carbon registry API integration layer has not yet cleared the queue. Neither outcome is acceptable at scale. And neither outcome is inevitable with proper architecture. The correct approach to carbon registry API integration under rate-limit constraints requires three components that most off-the-shelf platform frameworks do not include by default. First, an asynchronous message queue that decouples order book state transitions from registry API calls. Every retirement request is assigned an idempotency key at the moment the buyer’s order is matched, not at the point of registry submission. This ensures that if the registry API is unavailable or throttled and the request must be retried minutes or hours later, the registry receives exactly one effective retirement instruction, not duplicates. Second, a circuit breaker pattern that monitors registry API response times and error rates in real time. When a registry enters a degraded state, as legacy national registries do during system maintenance windows, the circuit breaker automatically pauses new inventory reservations against that registry’s credits. Buyers see accurate availability, not a snapshot frozen at the last successful sync. Third, and most critically: a reconciliation engine that continuously compares confirmed registry state against your platform’s internal state. The reconciliation engine is what converts carbon registry API integration from a connection into a trust guarantee. Schema Mismatches: The Invisible Tax on Registry Integration Even teams that architect the rate limit problem correctly often underestimate the second major challenge in carbon registry API integration: the complete absence of a shared data model across the registries your platform must connect to. Verra identifies each carbon credit unit using a serial number format that encodes the project, vintage year, and issuance batch in a specific pattern. Gold Standard uses a different identifier structure with separate account-holder credentials and project reference fields. I-REC – the international tracking standard for energy attribute certificates, increasingly traded alongside carbon credits – tracks certificates by production period and generating facility identifier, a model designed for energy generation accounting rather than emissions reduction verification. National compliance registries, particularly those being built to support regulated