
India’s carbon market is no longer a policy ambition on paper. India’s Carbon Market Portal went live at the International Conference on Carbon Markets, Prakriti 2026, in New Delhi, with Union Power Minister Manohar Lal announcing formal trading in Carbon Credit Certificates is expected within four months. That timeline is not a rumour — it is a procurement mandate disguised as a regulatory milestone. Trading under India’s Carbon Credit Trading Scheme is expected to start in the second half of 2026, covering around 740 obligated entities across nine energy-intensive sectors with legally binding emission intensity targets. For every business in those sectors — and for every technology company, ESG consultancy, financial institution, and climate-tech firm that serves them — the window to build a compliant carbon credit trading platform in India is not open indefinitely. It is closing, quarter by quarter, as first movers lock in infrastructure advantages. This blog is not about whether India’s carbon market will succeed. That question is settled. This is about whether your organisation will own the infrastructure that runs it — or pay to access someone else’s. What CCTS Actually Demands From a Carbon Credit Trading Platform in India Most discussions about the Carbon Credit Trading Scheme focus on policy timelines. Few address what the scheme technically requires from any carbon credit trading platform in India that wants to operate within it compliantly. The compliance mechanism under CCTS will be jointly managed by the Ministry of Power, the Ministry of Environment, Forest and Climate Change, and the Bureau of Energy Efficiency, with Carbon Credit Certificates traded through the country’s power exchanges and the Central Electricity Regulatory Commission acting as trading regulator. That multi-regulator structure has direct consequences for platform architecture. A carbon credit trading platform in India operating within CCTS must integrate with: 1. The BEE Registry (operated by Grid Controller of India Limited) the registry for issuance operated by Grid Controller of India Limited is being set up as the official CCC issuance infrastructure. Your platform must connect via API to track issuance, retirement, and transfer of certificates in real time. 2. Power Exchange Connectivity CCCs will trade on India’s power exchanges. A carbon credit trading platform in India that cannot connect to these exchange systems for order routing, price discovery, and settlement confirmation will be functionally unusable for compliance trading. 3. MRV Workflow Management the MRV framework requires annual verification of GHG emissions data, with BEE-accredited Carbon Verification Agencies certifying entity compliance. Your platform must support structured data ingestion from verifiers, document management for audit trails, and automated submission-ready reporting. 4. Emission Intensity Calculation Engine each covered entity receives GHG emissions intensity targets based on its sub-sector trajectory and relative emissions performance, set as tCO₂e per unit of output for three-year periods with annual compliance targets. The platform must calculate real-time performance against these intensity targets — not absolute emissions — which is architecturally distinct from most EU ETS-style platforms. 5. Dual Mechanism Support CCTS defines two mechanisms: a compliance mechanism for obligated entities and a voluntary project-based offset mechanism for non-obligated entities who can register GHG emission reduction projects for CCC issuance. A carbon credit trading platform in India serving both markets — as any serious operator should — needs separate workflow logic for compliance and voluntary credit issuance, while sharing a single registry integration layer. The Nine Sectors — And Why the ROI Window Is Sector-Specific The nine sectors designated for CCTS compliance are Aluminium, Chlor Alkali, Cement, Fertiliser, Iron & Steel, Pulp & Paper, Petrochemicals, Petroleum Refinery, and Textile. 461 companies across these nine energy-intensive sectors have been notified by BEE as obligated entities, with the price of one tonne of carbon credit in India under CCTS expected to range from ₹600–900 per tonne once market-driven trading commences. At 461 obligated entities each actively buying, selling, or banking Carbon Credit Certificates, the transaction infrastructure demand is substantial. But the ROI case for building a carbon credit trading platform in India does not rest only on serving obligated entities. In March 2025, the BEE released the Detailed Procedure for the Offset Mechanism, and the government approved eight methodologies for the domestic voluntary market, covering renewable energy, green hydrogen, industrial energy efficiency, landfill methane recovery, mangrove afforestation, offshore wind, and compressed biogas. That voluntary layer dramatically expands the addressable market. Renewable energy developers, green hydrogen producers, and forestry project operators — none of whom are compliance-obligated — can generate and trade CCCs. A carbon credit trading platform in India built to serve both compliance and voluntary participants becomes infrastructure for the entire Indian carbon economy, not just 461 industrial plants. The global carbon credit trading platform market is projected to grow from USD 235.50 million in 2026 to USD 1,272.11 million by 2034, a CAGR of 23.47%. India’s domestic market, given its scale — the CCTS compliance mechanism is set to initially cover over 700 million tonnes of CO₂e, placing India among the world’s largest emissions trading systems — will capture a significant share of that growth. The entities building the infrastructure now are not just compliance-ready. They are capturing a market that will compound for a decade. The ROI Calculus: What Early Movers Capture Building a carbon credit trading platform in India before H2 2026 trading commences delivers measurable ROI across three distinct vectors — none of which are purely speculative. Vector 1: Penalty Avoidance Infrastructure Penalties apply if covered entities fail to meet their compliance obligations. For energy-intensive manufacturers currently without digital MRV and CCC management infrastructure, the first compliance cycle represents direct financial risk. A purpose-built platform converts that risk into a managed process — quantifiable as avoided penalty exposure across the first three-year compliance period. Vector 2: CCC Price Timing Advantage With ₹600–900 per tonne pricing expected and unlimited banking of CCCs permitted, entities that overachieve their intensity targets in early cycles hold certificates with appreciating value. A carbon credit trading platform in India with real-time intensity tracking allows operators to make informed decisions about banking

On the morning of March 26, 2026, Brent crude crossed $107 a barrel. Oil traders held their breath. CFOs across every energy-intensive sector scrambled to recalculate Q2 forecasts. And somewhere in the noise, a quieter, more consequential question surfaced one that most boardrooms are not yet asking: What does $100+ oil mean for carbon credit trading platform development? The answer is counterintuitive, commercially significant, and for the businesses reading this, time-sensitive. The Paradox Nobody Is Talking About Wars are terrible for short-term climate investment. Nobody disputes that. When the US-Israel strikes on Iran disrupted the Strait of Hormuz, and Brent surged 15% overnight, the initial narrative was predictable: energy security over climate ambition, fossil fuels back in the spotlight, green transition on pause. But history disagrees with that narrative – and the data from the last three weeks of trading confirms it. The same pattern played out in 2022 when Russia invaded Ukraine. Oil spiked. LNG markets fractured. Governments that had been drifting on clean energy suddenly found religion, not because they had a moral awakening, but because energy independence became the most urgent national security issue on the table. Europe deployed renewables at record speed. Solar and wind installations accelerated. And carbon markets? They expanded. This time, the mechanism is clearer. Compliance carbon markets operate on a direct link to emissions: when industries burn more coal and heavy fuel oil as substitutes for restricted LNG, exactly what BloombergNEF analysts flagged is already happening in this conflict — their carbon liability increases. They must buy more credits. Carbon credit demand rises precisely when fossil fuel chaos strikes. That is not a coincidence. It is the architecture of the system working exactly as designed. What the Numbers Actually Say Right Now Let us get specific, because this is where the ROI case for carbon credit trading platform development becomes undeniable. The global carbon credit trading platform market was valued at $235.50 million in 2026 and is projected to reach $1.272 billion by 2034 – a CAGR of 23.47%. That trajectory was built on regulatory tailwinds alone. Now add a geopolitical multiplier that is forcing higher emissions in the short term while simultaneously making renewable energy more strategically attractive. The voluntary carbon market, which reached $1.88 billion in 2025, is expected to climb to $2.29 billion in 2026 and $4.92 billion by 2030. Even under a war economy — where corporate spending tightens temporarily — the compliance market picks up the slack. When utilities burn coal because Qatari LNG is stuck behind a military blockade at the Strait of Hormuz, they generate carbon liabilities that cannot be deferred. On European markets as of March 26, EUA carbon allowances for December 2026 were trading at €70.74 per tonne, firming upward as geopolitical tensions held. Energy market analysts noted that carbon, gas, and power prices are all now moving in lockstep with Middle East headlines. This is a structural integration that was not this visible before February 2026. The practical implication for your business: Every week of elevated oil prices is a week where carbon compliance pressure intensifies, carbon credit platform transaction volumes grow, and the window for first-mover carbon credit trading platform development narrows. Why War Paradoxically Accelerates the Green Transition – And Your Platform Opportunity Here is the mechanism that investors and enterprise strategists often underestimate. Energy pain creates energy urgency. India, currently facing a weakening rupee and rising inflation from imported oil dependency, is accelerating solar deployment not as a climate gesture but as a survival strategy. Nations that relied on Qatari LNG through the Strait of Hormuz – now functionally impaired – are stress-testing every alternative they have. That urgency does not dissipate when the conflict ends. It crystallizes into policy, infrastructure, and procurement decisions that last a decade. Each of those policy decisions generates carbon market activity. Carbon credit trading platform development sits at the infrastructure layer of all of it. Consider the compliance pathway: As countries tighten emissions frameworks in response to temporarily elevated fossil fuel use, they need digital infrastructure to manage, verify, and trade carbon credits at scale. The EU’s Carbon Border Adjustment Mechanism is expanding. India’s Carbon Credit Trading Scheme under the Bureau of Energy Efficiency is formalizing. Saudi Arabia is advancing its own Greenhouse Gas Crediting and Offsetting Mechanism. These are not distant prospects — they are live market structures being built right now, and they all require robust carbon credit trading platform development to function. Consider the voluntary pathway: ESG-driven corporates whose Q1 energy costs just jumped 20-30% are not abandoning net-zero commitments – they are looking for cost-efficient ways to meet them. A well-built carbon credit trading platform that aggregates high-quality credits, reduces broker spreads, and automates compliance reporting becomes a procurement tool, not just a sustainability checkbox. Either way, the demand side of the carbon market is expanding. The question is who owns the infrastructure that serves it. The ROI Case for Carbon Credit Trading Platform Development: Built for This Moment Let us be direct about why carbon credit trading platform development is a high-return investment in the current environment — and why that return is measurable, not aspirational. What Techaroha Builds – And Why It Matters for Your ROI Techaroha develops carbon credit trading platforms as purpose-built commercial infrastructure, not generic marketplace templates. Our implementations include smart contract-based credit issuance and retirement, AI-powered MRV verification that commands 15–25% credit price premiums, fractional tokenization for market liquidity, and real-time compliance dashboards aligned to EU ETS, CORSIA, India CCTS, and Article 6.4 frameworks. For enterprises entering carbon markets in 2026, under the pressure of $100+ oil, rising compliance obligations, and tightening regulatory frameworks, the architecture decisions made at platform inception determine whether you build a $2M compliance tool or a $20M revenue-generating infrastructure asset. The carbon market does not care whether peace negotiations succeed or fail. Compliance obligations accrue either way. Credit prices rise with geopolitical uncertainty. Transaction volume grows as more enterprises need to offset emissions they cannot yet reduce.
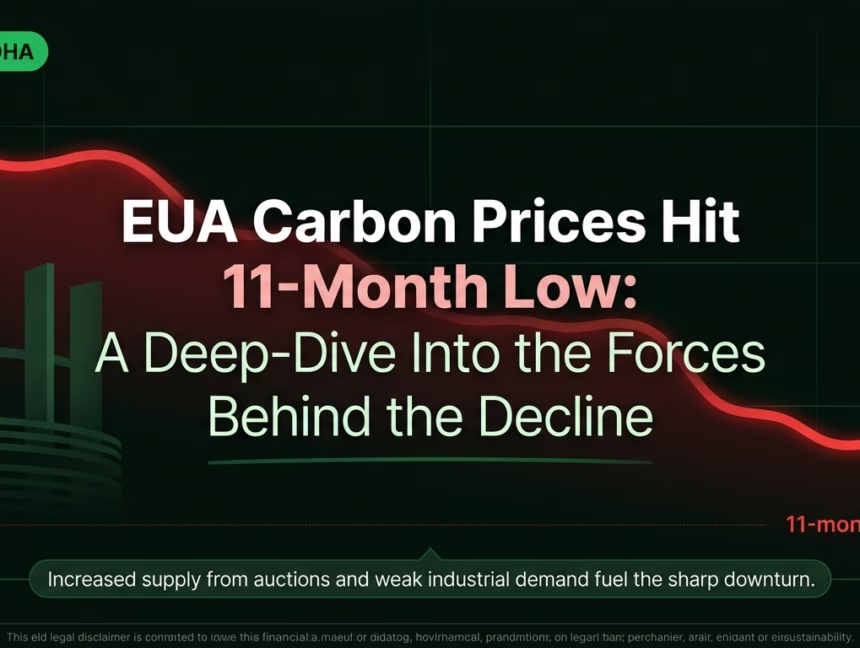
Published by Techaroha | Market Analysis | March 20, 2026 | Carbon Markets Weekly 1. What Happened This Week: The Price Action in Context European carbon allowances entered the week of March 17–20, 2026 under considerable selling pressure. The EUA December 2026 contract, the most liquid benchmark contract on the Intercontinental Exchange (ICE), fell for the sixth time in seven sessions, eventually closing Friday at €66.65/tonne. This marks the lowest settlement since April 2025 and represents a cumulative decline of over 27% from the year’s intraday high of €92.04, reached on January 19, 2026. Day EUA Price (€/tonne) Daily Change Key Event Monday Mar 17 €71.15 Base EU Summit agenda published Tuesday Mar 18 €70.42 ▼ −0.73 Von der Leyen MSR letter released Wednesday Mar 19 €68.90 ▼ −1.52 10-country letter to Commission Thursday Mar 20 €67.24 ▼ −1.66 EU Council summit Day 1 Friday Mar 20 €66.65 ▼ −0.59 Week close — 11-month low Table 1: EUA Dec’26 daily settlement prices, week of March 17–20, 2026. Source: ICE / Techaroha. To put this decline in historical context: EUA prices averaged €65/tonne in 2024 and had been forecast by institutions including ING Think to average €83/tonne across 2026 on the back of tightening supply. That bullish fundamental case has been overwhelmed, at least in the short term, by the political and regulatory uncertainty described in the sections below. 2. The EU Summit: Carbon Pricing in the Political Crossfire The March 19–20 European Council summit in Brussels was the single most consequential near-term catalyst for carbon prices this week. Although formally centred on the EU’s response to economic pressures from the ongoing Middle East conflict, the summit placed energy cost reduction and by extension the future of the ETS squarely on the agenda for EU heads of government. Commission President Ursula von der Leyen set the tone in a letter to summit participants in which she outlined measures to tackle rising energy costs across four pillars: electricity prices, network and grid charges, taxes and levies, and carbon costs. Critically, the letter signalled that the Commission would shortly adopt ETS benchmarks “taking into account concerns expressed by industry,” a phrase the market interpreted as a concession to lobbying pressure from carbon-intensive sectors. Von der Leyen also stated that the Commission would propose “to increase the firepower of the Market Stability Reserve (MSR), so that it can more effectively address excessive price volatility.” This was a double-edged signal: while a stronger MSR can support prices long-term by withdrawing allowances from circulation during surplus conditions, traders interpreted the language as opening the door for short-term price intervention, which depressed sentiment. 3. The 10-Country Letter: A Political Rebellion Against the ETS On Wednesday, March 18, the day before the summit opened, leaders of ten EU member states delivered a formal letter to the European Commission describing the current ETS framework as an “existential risk” for European strategic industries. The signatory countries were Austria, the Czech Republic, Croatia, Greece, Hungary, Italy, Poland, Romania, Slovakia, and one additional Eastern European state. Their demands were specific and far-reaching: The letter argued that energy-intensive industries, particularly those hardest to decarbonise (steel, cement, chemicals, glass), face a “perfect storm” of rising costs, unproven green technologies, and the accelerating loss of free carbon allowances that have historically shielded them from full ETS costs. Combined with energy prices elevated by the Middle East conflict and US tariffs constraining EU export competitiveness, the coalition argued the current framework threatens deindustrialisation. The political weight of this letter should not be underestimated. Ten member states collectively represent a blocking minority in EU Council procedures. Their coordinated action signals that ETS reform is no longer an industry lobbying campaign; it has entered the formal political process. This shift fundamentally changes the reform probability calculus for market participants. Industry and Academic Opposition to ETS Weakening The ten-country push has met significant institutional resistance. Bruegel, the Brussels-based economic think tank, published an analysis arguing that weakening the ETS would be “economic self-sabotage” on five grounds: This debate will directly shape the ETS Directive revision due in 2026 – the outcome of which represents the single largest structural risk (and opportunity) in the carbon market. 4. The Middle East Energy Crisis: Carbon’s Decoupling from Gas A critical and often misunderstood dynamic this week was the unusual decoupling of EUA prices from natural gas prices – a relationship that has historically been one of the strongest correlations in European energy markets. The ICE December 2026 Dutch TTF contract surged 40% between February 27 and March 3, driven by the escalating US-Israel military action against Iran and concerns about disruptions to LNG supply routes through the Strait of Hormuz. Normally, higher gas prices increase carbon demand: utilities switch to coal (higher emissions, needing more EUAs) and industrial producers face higher input costs, reducing output and triggering EUA purchases to cover compliance obligations. This time, however, the political overhang from ETS reform speculation was powerful enough to suppress the typical carbon-gas correlation. While gas spiked, EUAs remained under pressure, reflecting the market’s judgment that near-term reform risk outweighs fundamental supply-demand tightening. European gas storage levels compounded concerns, with storage at just 29% capacity on March 12 – well below seasonal averages and approaching the lows last seen during the 2022 energy crisis. Market Indicator Value Change vs. Prior Week Direction EUA Dec’26 (ICE) €66.65/tonne √−6.3% ▼ Bearish TTF Gas Dec’26 (ICE) €45.33/MMBtu +40% (2-wk) ▲ Bullish EU Gas Storage 29% Below 5-yr avg ⚠ Warning Speculative Fund Longs 94M allowances −6.6% (Feb wk) ▼ Reducing UK Allowance (UKA) GBP 53.28/tonne Wider spread vs EUA ▼ Lagging Table 2: Key cross-market indicators, week of March 20, 2026. Sources: ICE, E3G, S&P Global. 5. Speculative Positioning: The Long Unwind Structural selling from financial investors has been a significant amplifier of the price decline. According to ICE Commitment of Traders (COT) data, investment funds held approximately 94 million allowances in long positions as of the week ending February