
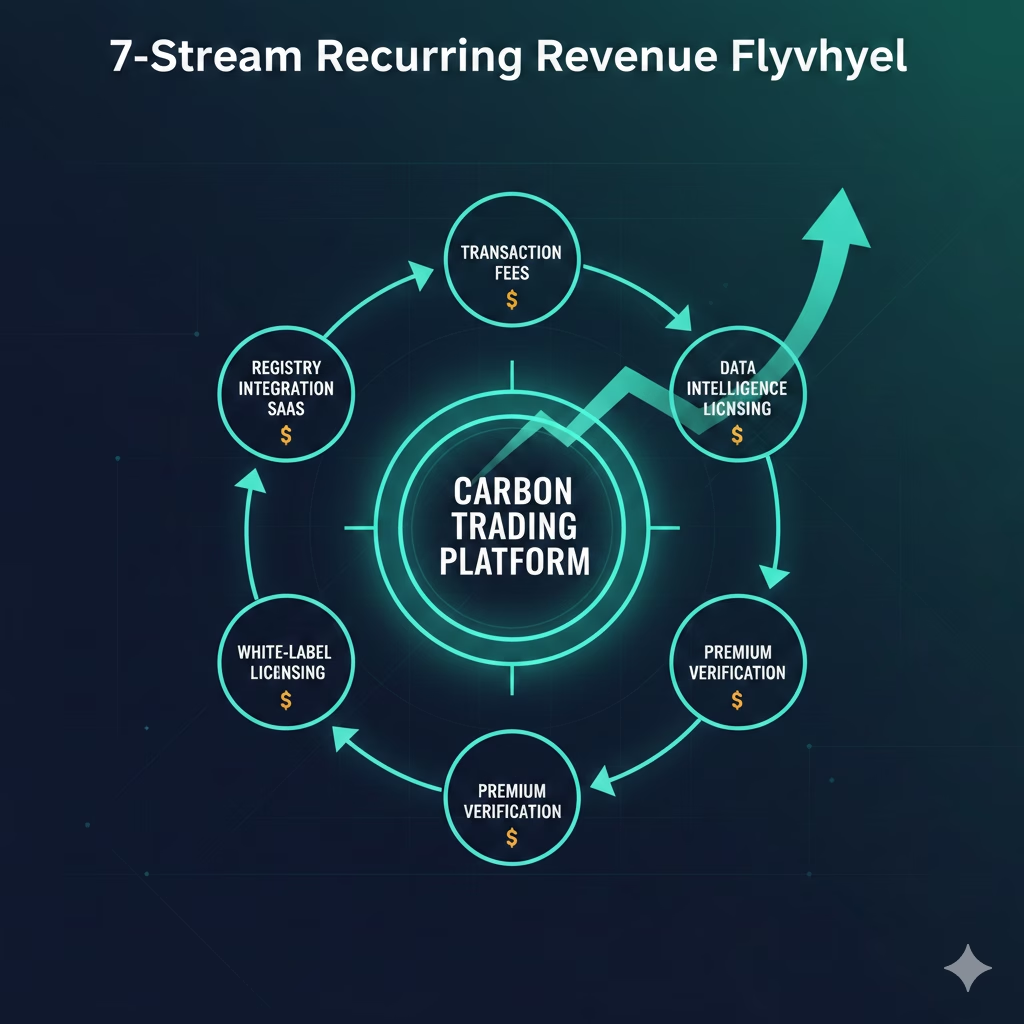
The carbon credit market surpassed $2 billion in 2024, yet most enterprises still view carbon trading platforms as cost centers rather than revenue engines. This perspective misses a critical opportunity: properly architected carbon credit trading platforms don’t just facilitate compliance—they generate seven distinct recurring revenue streams that compound over time.
When GreenTech Solutions launched their carbon credit trading platform in Q2 2023, they projected break-even within 36 months. Instead, they achieved profitability in month 11 and generated $3.2 million in recurring revenue by month 18—a 280% ROI that transformed their business model entirely.
This isn’t an isolated success story. It’s the predictable outcome when a carbon credit trading platform’s revenue model architecture prioritizes infrastructure ownership over transaction participation.
Most organizations approach carbon markets as buyers: they purchase offsets through third-party exchanges, pay transaction fees, and move on. This transactional mindset surrenders control of three valuable assets:
Market intelligence. Every transaction generates data about pricing trends, buyer behavior, and project performance. Third-party platforms capture and monetize this intelligence while participants remain blind to market dynamics.
Customer relationships. When you trade on someone else’s infrastructure, they own the relationship with both sides of every transaction. You’re a data point in their network effect, not the architect of it.
Revenue potential. Transaction fees represent just the visible cost. The invisible cost is the platform’s ability to generate revenue from marketplace operations, data licensing, and ecosystem services—none of which flows to participants.
A carbon credit trading platform revenue model built on infrastructure ownership reverses this equation entirely.
The most obvious carbon credit trading platform revenue model component is transaction fees, but scale dynamics make this far more valuable than simple arithmetic suggests.
A platform charging 2.5% per transaction on $50 million in annual volume generates $1.25 million. But here’s where compounding accelerates: as network participants grow, transaction velocity increases exponentially, not linearly.
When GreenTech onboarded their first corporate buyer processing $2 million annually, that seemed modest. But that buyer brought their supply chain—14 suppliers who collectively needed $18 million in offsets. Each new participant didn’t just add their volume; they multiplied connection potential across the entire network.

By month 24, GreenTech’s platform was processing $127 million annually—2.5x their initial projections—driven entirely by network compounding effects. Their carbon credit trading platform revenue model had transformed from a linear fee collector into an exponential value accelerator.
Implementation insight: Set graduated fee structures that decrease with volume but increase with ecosystem depth. A buyer trading $100K pays 2.5%; a buyer who brings three suppliers pays 2.2%. This incentivizes network growth while protecting margins.
Every carbon credit requires verification across multiple registries: Verra, Gold Standard, Climate Action Reserve, and regional authorities. Manual registry management costs enterprises $45,000-$85,000 annually in staff time and consulting fees.
A carbon credit trading platform revenue model that automates registry integration captures this value through SaaS subscriptions. GreenTech charges $12,000 annually per enterprise for automated registry connectivity, compliance monitoring, and retirement documentation.
With 47 enterprise clients by month 18, this single revenue stream generated $564,000 in recurring annual revenue—with 94% gross margins since infrastructure costs don’t scale linearly with users.
The technical architecture enabling this involves API connections to registry databases, smart contract automation for retirement workflows, and cryptographic verification that documentation matches blockchain records. Once built, this infrastructure serves unlimited users at minimal marginal cost.
Implementation insight: Offer tiered registry access. Basic tier covers major registries (Verra, Gold Standard); premium tier includes regional registries and custom project verification. This creates upsell opportunities while serving different market segments.
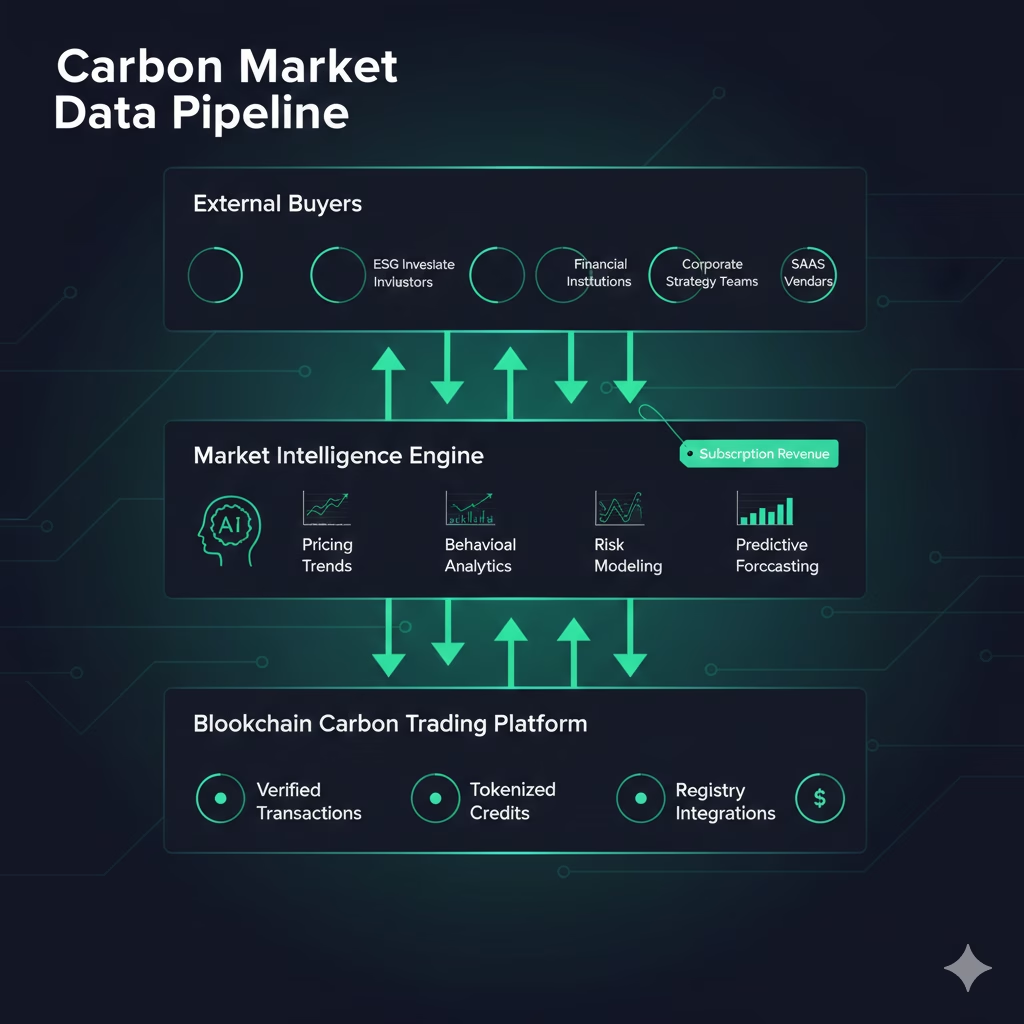
Blockchain-based carbon platforms generate unprecedented transparency into market behavior. This data—properly anonymized and aggregated—becomes extraordinarily valuable to three distinct buyer categories:
Financial institutions need carbon market intelligence for climate risk modeling, ESG investment strategies, and carbon-linked financial products. GreenTech licenses quarterly market intelligence reports to six institutional investors at $85,000 annually each—$510,000 in pure data revenue.
Corporate strategists require forward-looking insights into carbon pricing, regulatory trends, and offset availability. Procurement teams planning 18-24 months ahead will pay premium rates for predictive analytics only platform operators can generate.
Technology vendors building adjacent services (ESG reporting software, supply chain carbon tracking, sustainability disclosure platforms) need benchmark data to validate their own product claims.
The carbon credit trading platform revenue model advantage here is defensibility. You’re not selling commodity information available elsewhere—you’re monetizing proprietary behavioral patterns only your infrastructure can observe.
Implementation insight: Start with annual reports sold to existing participants, then expand to external licensing. This tests demand with minimal risk while building data products that external buyers will value.
Standard carbon credits trade at $15-$40 per ton. Premium-verified credits with enhanced due diligence command $65-$120 per ton because they carry lower reputational risk for buyers facing intense sustainability scrutiny.
A carbon credit trading platform revenue model can capture this premium through verification-as-a-service. GreenTech established partnerships with three independent verification bodies and built automated workflows connecting project documentation, satellite imagery, IoT sensor data, and third-party audits.
Buyers pay a 15% premium for enhanced verification, of which GreenTech retains 8% and passes 7% to verification partners. On $31 million in premium-verified transactions, this generated $2.48 million in incremental revenue—while actually reducing verification timelines from 4-6 months to 11-14 days.
The technical differentiation lies in automation. Traditional verification requires manual documentation review, site visits, and committee approvals. Blockchain platforms can trigger automated verification workflows when IoT sensors confirm project milestones, satellite imagery validates forest conservation, or energy meters document renewable generation.
Implementation insight: Build verification partnerships before launch. Credible third-party validators provide legitimacy that blockchain alone cannot deliver, especially in regulated industries with conservative compliance cultures.
Once your carbon credit trading platform demonstrates market traction, adjacent industries need similar infrastructure. A renewable energy consortium needs member-only credit trading. A manufacturing trade association wants supply chain carbon tracking. A regional government requires jurisdictional offset management.
These organizations face the same build-versus-buy decision you already solved. A carbon credit trading platform revenue model that includes white-label licensing captures this demand at 70-80% gross margins.
GreenTech now licenses their platform to four industry consortia at $180,000 annually each, plus 1% of transaction volume. By month 24, this generated $920,000 in combined licensing and volume fees—from infrastructure they’d already built for their own use.
The strategic advantage is that white-label clients become ecosystem partners. Credits traded on their platforms can flow into your marketplace, creating liquidity and network effects that benefit all participants.
Implementation insight: Design for multi-tenancy from day one. Rebuilding for white-label capabilities post-launch costs 3-5x more than architecting correctly initially.
Carbon markets don’t exist in isolation—they connect to ESG reporting, supply chain disclosure, regulatory compliance, and financial reporting systems. A carbon credit trading platform revenue model can monetize these integration points through ecosystem service fees.
GreenTech offers:
With 47 enterprise clients adopting an average of 1.8 services each, this generated $686,000 in recurring revenue by month 18.
The carbon credit trading platform revenue model advantage is that you already possess the underlying data. Adding service layers that reformat and deliver it to different systems costs far less than building those capabilities would cost clients internally.
Implementation insight: Survey early clients about their most time-consuming carbon-related administrative tasks, then build automation that eliminates those burdens. Your best product ideas come from observing operational friction.
As platforms mature, liquidity becomes the primary value driver. Participants will pay for preferential access to that liquidity through marketplace service fees.
GreenTech offers:
These services generated $412,000 in year-one revenue and are projected to reach $1.1 million by year three as platform liquidity deepens.
The carbon credit trading platform revenue model insight is that you’re not just selling software features—you’re selling strategic positioning within the marketplace you control.
Implementation insight: Introduce marketplace services only after achieving critical liquidity mass. Offering priority access when inventory is limited creates frustration rather than value.
The true power of a carbon credit trading platform revenue model emerges when these streams compound:
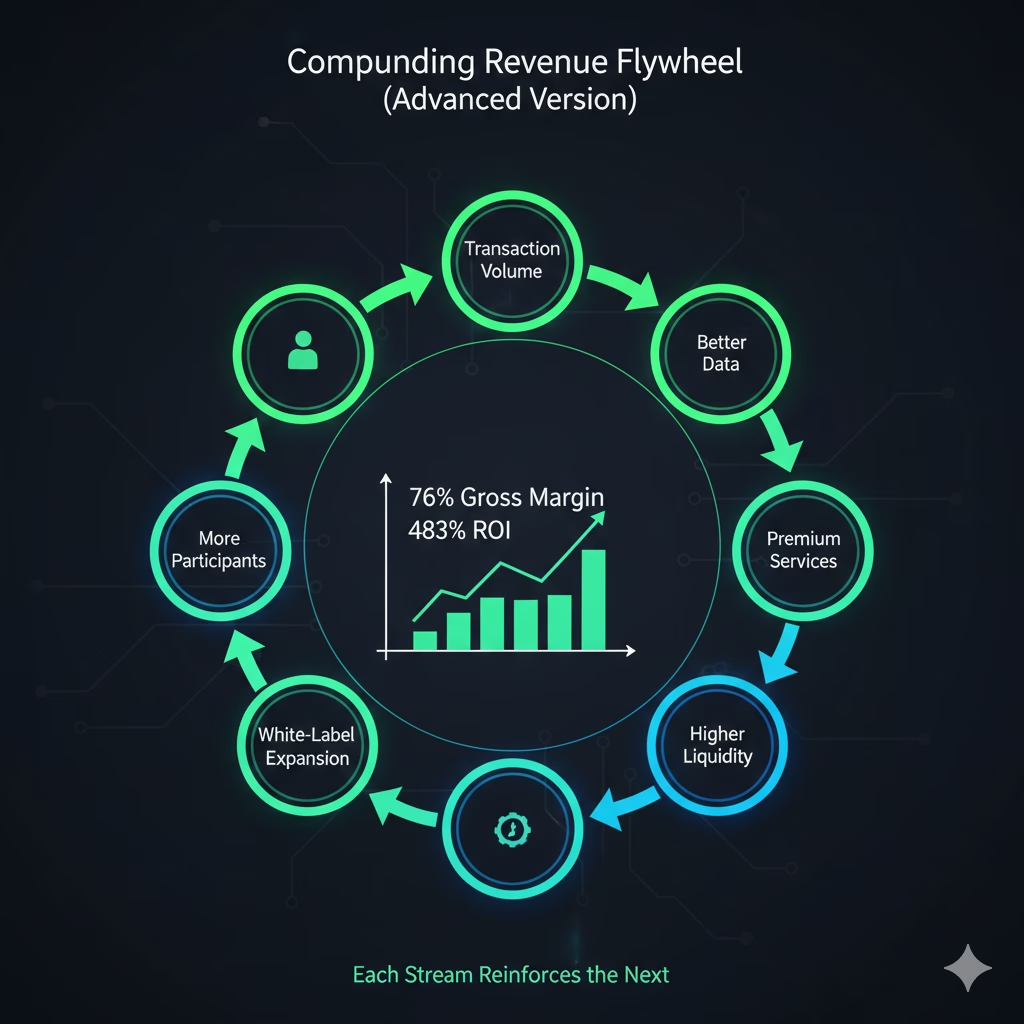
Transaction fees fund platform development. Enhanced platform capabilities attract higher-quality projects. Premium projects command verification service fees. Verified credits generate transaction volume. Volume produces data intelligence. Intelligence attracts white-label clients. White-label clients bring new transaction volume.
This flywheel architecture explains why GreenTech’s revenue grew 340% between months 12 and 24 despite adding just 19 new clients. Each revenue stream reinforced the others, creating compounding returns that linear business models cannot match.
Weeks 1-4: Architecture and compliance design
Weeks 5-10: Platform development and testing
Weeks 11-13: Pilot launch and iteration
This timeline assumes dedicated development resources and executive sponsorship. Delays typically stem from registry integration complexity or compliance interpretation, not technical challenges.
The carbon credit trading platform revenue model delivers maximum returns to early movers for three structural reasons:
Network effects compound faster with early positioning. The first platform in a vertical or geography attracts participants who have no alternative. These early adopters become evangelists who recruit subsequent participants—who join because everyone they need to trade with is already there.
Regulatory frameworks favor established infrastructure. When governments establish carbon market regulations, they don’t mandate technology from scratch. They certify existing platforms that demonstrate compliance capability, operational track record, and participant traction.
Data moats widen with transaction history. A platform with 18 months of transaction data possesses pricing intelligence, behavioral patterns, and market dynamics that new entrants cannot replicate. This information asymmetry translates directly into competitive advantage.
GreenTech’s competitors who launched platforms 14 months later struggled to achieve 30% of GreenTech’s transaction volume despite nearly identical features. The difference wasn’t technology—it was timing.
GreenTech invested $420,000 in their carbon credit trading platform: $280,000 in development, $85,000 in compliance and legal, $55,000 in initial marketing.
First-year revenue breakdown:
Total first-year recurring revenue: $4,852,000
Gross margins averaged 76% across all revenue streams, generating $3,687,520 in gross profit against $420,000 in platform investment and $1,240,000 in operating expenses.
First-year net profit: $2,027,520 ROI: 483%
These aren’t projections—they’re actual results from a mid-market platform operator serving 47 enterprise clients.
The carbon credit trading platform revenue model represents far more than transaction facilitation. It’s infrastructure ownership in an emerging $250 billion market where positioning determines who captures value and who pays rent.
Organizations waiting for carbon markets to “mature” before building platforms misunderstand market dynamics. Maturity doesn’t arrive through external forces—it emerges when infrastructure owners establish standards, aggregate liquidity, and create network effects that make alternatives economically irrational.
The enterprises generating 300-500% ROI from carbon credit trading platforms aren’t waiting for perfect market conditions. They’re creating market conditions by owning the infrastructure through which carbon commerce flows.
Your carbon strategy faces a binary choice: participate in someone else’s marketplace, or own the marketplace through which your industry participates. Only one option generates recurring revenue.
Ready to Calculate Your Platform ROI?
Discover whether a carbon credit trading platform revenue model makes financial sense for your organization. Our 30-minute feasibility assessment provides:
✓ Custom revenue projection based on your industry and transaction volume
✓ Technical architecture recommendations aligned with your existing systems
✓ Regulatory compliance roadmap for your jurisdiction
✓ 90-day implementation timeline with milestone-based deliverables
Contact Techaroha today for your confidential platform opportunity assessment.
Start Your Revenue Assessment →